

Fixed Income
Flexibility is required

An increase in yields around the world won’t help income-focused investors.
Although global sovereign bond yields may have bottomed and have started to increase in some areas, they won’t be going back to their long-term averages in the near term. In addition, approximately $13 trillion USD of global bonds have a negative yield.
10‑year government bond yields (%)

Source: Bloomberg as of September 30, 2021. Ratings are from Standard & Poor’s and are subject to change. Foreign investing, especially in emerging markets, has additional risks, such as currency and market volatility and political and social instability. The commentary on this page is that of Manulife Investment Management. Performance histories are not indicative of future results.
The U.S. 10-Year Treasury Yield should trend higher.
A simplistic way of looking at the real US 10-Year Treasury yield is to reduce the yield by current inflation. Over the last 10 years, the median real yield has been 32 bps. If we were to apply that to inflation between 2.0%–2.5%, that would imply a 10-Year yield of approximately 2.30%–2.80%. We believe the risk to long yields is greater than 2.0% through 2022.
US 10-Year Treasury Yields (Real vs Nominal)
Last 10 Years through September 2021
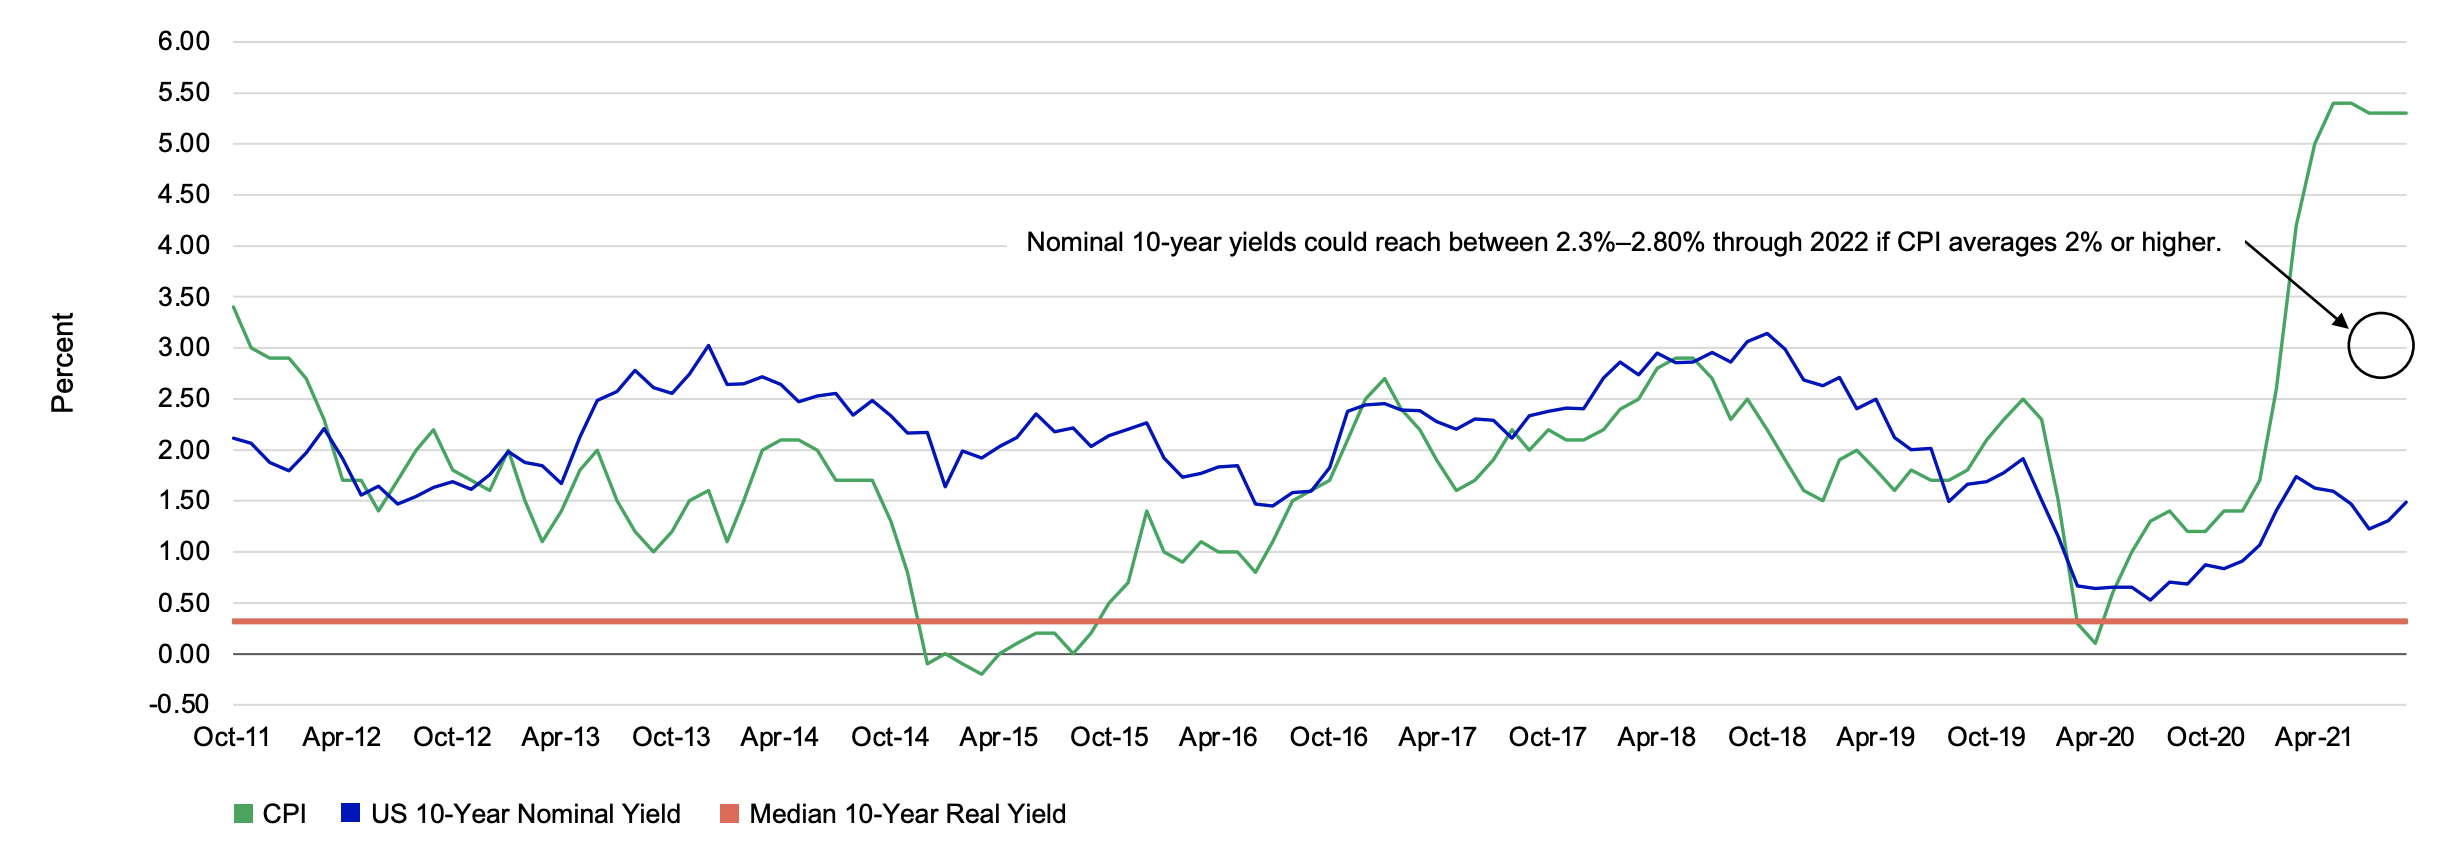
Source: Manulife Investment Management, Bloomberg as of September 30, 2021
Move to the better relative opportunity
In an environment of improving global economic growth, yield curves are likely to steepen. Typically, when this happens, credit outperforms government bonds and lower duration outperforms longer duration. In fixed-income, it’s important to understand the landscape going forward and be able to move to the better relative opportunity.

Source: As of September 30, 2021. Floating rate (S&P/LSTA Leveraged Loan Index), Canada bond universe (DEX Universe Bond), Canada investment-grade corporate bonds (DEX Corporate Bond), Canadian government bond (DEX Federal Universe Bond), Canadian short-term bonds (DEX Short Term Bond), global bonds (Barclays Global Aggregate), U.S. high-yield (BofA ML US High Yield Master II Unconstrained), emerging market debt (JPM EMBI Global Diversified Index)
The Canadian dollar is undervalued relative to its historical relationships.
The Canadian dollar has deviated from its historical correlation to oil prices and the 2-year interest rate spread with the U.S. As such, as at the end of the quarter it is trading significantly below its fair value. Our fair value model would suggest the CADUSD should trade near US$0.87, however external factors are limiting its upside our 6–12-month target for the CADUSD is US$0.81-0.83.
Modeled CAD/USD Exchange Rate vs Actual CAD/USD Exchange Rate
Last 10 Years to Current

Source: Manulife Investment Management, Bloomberg. As of September 30, 2021
Manulife Investment Management’s sample strategy
 | ||||
Canadian equities • Favour a selective approach to Canadian equities. • Consider diversifying business risks, not just sectors.
|
US Equities • Look for opportunities to take advantage of market dislocations. • Consider dollar‑cost averaging into equities. |
International developed market equities • Consider less constrained strategies that can seek out opportunities wherever they may present themselves. |
Emerging Market equities Opportunities may exist within the emerging markets, specifically in the Asia ex‑Japan region. |
Fixed Income • Favour flexible strategies that can seize opportunities wherever they may be. •Consider using different types of bonds for different objectives, whether it is downside protection or enhanced yield. •Be mindful of the potential currency impact on global allocations.
|
Source: Manulife Investment Management as of March 31, 2021. For illustration purposes only. Performance histories are not indicative of future returns. The information in this document does not replace or supersede KYC (know your client) suitability, needs analysis or any other regulatory requirements. Clients should seek the advice of professionals before making any investment decisions.