

Why dividends matter — an ode to George redux
My motto is: The best possible results.
– George Henry Ross Goobey
Our readers may or may not remember, we wrote about the importance of dividend-paying stocks back in 2011 following the Great Financial Crisis and again in 2016. At the time, we expressed the need to use dividends as part of an income solution in an ultra-low yield environment. The key message wasn’t to search out the highest-yielding stocks, but more towards those that paid a sustainable and growing dividend. Back then, it seemed that the developed market government bond environment couldn’t get any worse, as the U.S. 10-year Treasury yield was near what was then an all-time low of 1.56%, while there were approximately US$13 trillion dollars of negative-yielding developed market sovereign bonds around the world.
Fast forward four years and the 10-year yield has broken through those record lows, hitting 0.50%, before rebounding slightly to 0.95% at time of writing. Global negative-yielding debt has jumped 30% to reach an all-time high of approximately US$ 17 trillion, as governments and central banks around the world expand their balance sheets in effort to stimulate economic growth.
10-year Government Bond Yields
2014 - current

Source: Manulife Investment Management, Bloomberg, as of November 30, 2020
Global Negative Yielding Debt Market Value (US$)
2013 - current

Source: Manulife Investment Management, Bloomberg, as of November 30, 2020
In the next 10 years, every baby boomer will be age 65 or older. According to the Government of Ontario, the 65 and older age cohort in Ontario is growing at a rate of 3.3% per year. Retirement funding among this low bond yield environment could be the biggest risk that these retirees will face, as investors need to be aware of the required returns necessary to fund their cash flow in retirement. It’s not just pension plans that need to use liability-driven investment (LDI) strategies but also any investor who’s saving for retirement or already in retirement. LDI strategies can be complicated, but in their simplest form, they’re basing the investment strategy or asset mix on the cash flow needed to fund future liabilities, namely one's expenses in retirement.
Many investors have never heard of George Henry Ross Goobey, but those who have know that he was a revolutionary mind in the pension world. As the pension manager of British Imperial Tobacco, Ross Goobey convinced the pension board back in the 1950s to invest the entirety of the Imperial Tobacco pension fund in equities and advocated equity investment as an appropriate policy for pension funds. He did so because, at the time, dividend yields were higher than bond yields and because he accurately foresaw that dividends would rise over time in line with the underlying growth of the British economy during a period of rising inflation. His central role in the widespread shift of pension funds from investing predominantly in fixed income to investing in equities, known as the “cult of equity,” made him one of the most influential investors in the U.K. We bring this up not just to praise Ross Goobey for the job he did, but to draw a parallel between the yield environment of his day and ours today. For example, in 1956, U.S. 10-year Treasuries were yielding an average of 2.05%. Today, those government bonds yield 0.95%.
The current yield of a bond typically gives the investor the annual return that can be expected over the life of the bond. For today’s income-seeking investor, a return of 0.95% per year for the next ten years falls well short of their return requirements, especially after factoring in the impact of inflation and taxation. For example, if we assume a 2% rate of inflation and a 40% tax rate, a person needs a return of 3.3% per year just to maintain their year-over-year purchasing power.
Ross Goobey saw two main risks in the overweight to government debt at the time. First, he saw the risk that yields may be moving higher given that inflation was moving higher. If yields moved higher, the pension fund would be facing a negative return on its fixed income. Secondly, he saw that the current yields offered by the government debt weren’t enough to cover the pension fund’s future liabilities. We very likely find ourselves with those exact same problems today.
A pension plan or individual investor could invest merely in government bonds as a means to a retirement income end. However, in recognizing that future income needs will be impacted by inflation and that bond yields today may not accurately price or protect against future inflation, then it’s up to us to achieve the best possible results. From Ross Goobey’s perspective, this meant investing in dividend-paying stocks. His proposal was to shift the entire pension fund assets from bonds to 100% in equities, which was completed in the mid 1950s.
It’s a very simple idea. While bonds come with certain guarantees of income in the form of coupon and principal payments, they also come with a guarantee (for the most part) that an investor will never receive more income than the stated coupon (this assumes that there are no capital gains earned). With a dividend-paying stock, there’s no guarantee that a company will increase or even maintain the dividend; however, there’s at least the chance. And companies tend to have a degree of pricing power that, over time, can be exercised to keep prices and, therefore, earnings growing at least at the pace of inflation.
It’s also not enough to just look for the highest dividend yield. Companies with a high dividend yield may be at risk of cutting that dividend, or that higher yield may be a result of a depressed share price. Both situations may favour avoiding investing in that company. Ross Goobey highlighted the mistakes in assessing dividend-paying equities merely by the current dividend yield. "The calculation of the yield of an ordinary stock and share is not a simple matter, but a very simple device is used, and, unfortunately, I think it gives a very wrong impression."1 Here, Ross Goobey downplays the current dividend yield of a stock in favour of estimating what the potential income might be over 30‒40 years and relating that to the current price — in other words, favour dividend growers.
Let's say company X, for example, has a dividend yield today of 2.5%. If company X increases its dividend at an annual rate of 12%, the yield on cost will double to 5% in six years. There are many companies that fall into this category. And, in fact, it isn't difficult to find companies that have paid dividends consistently for over 100 years and grown annually for over 25 years.
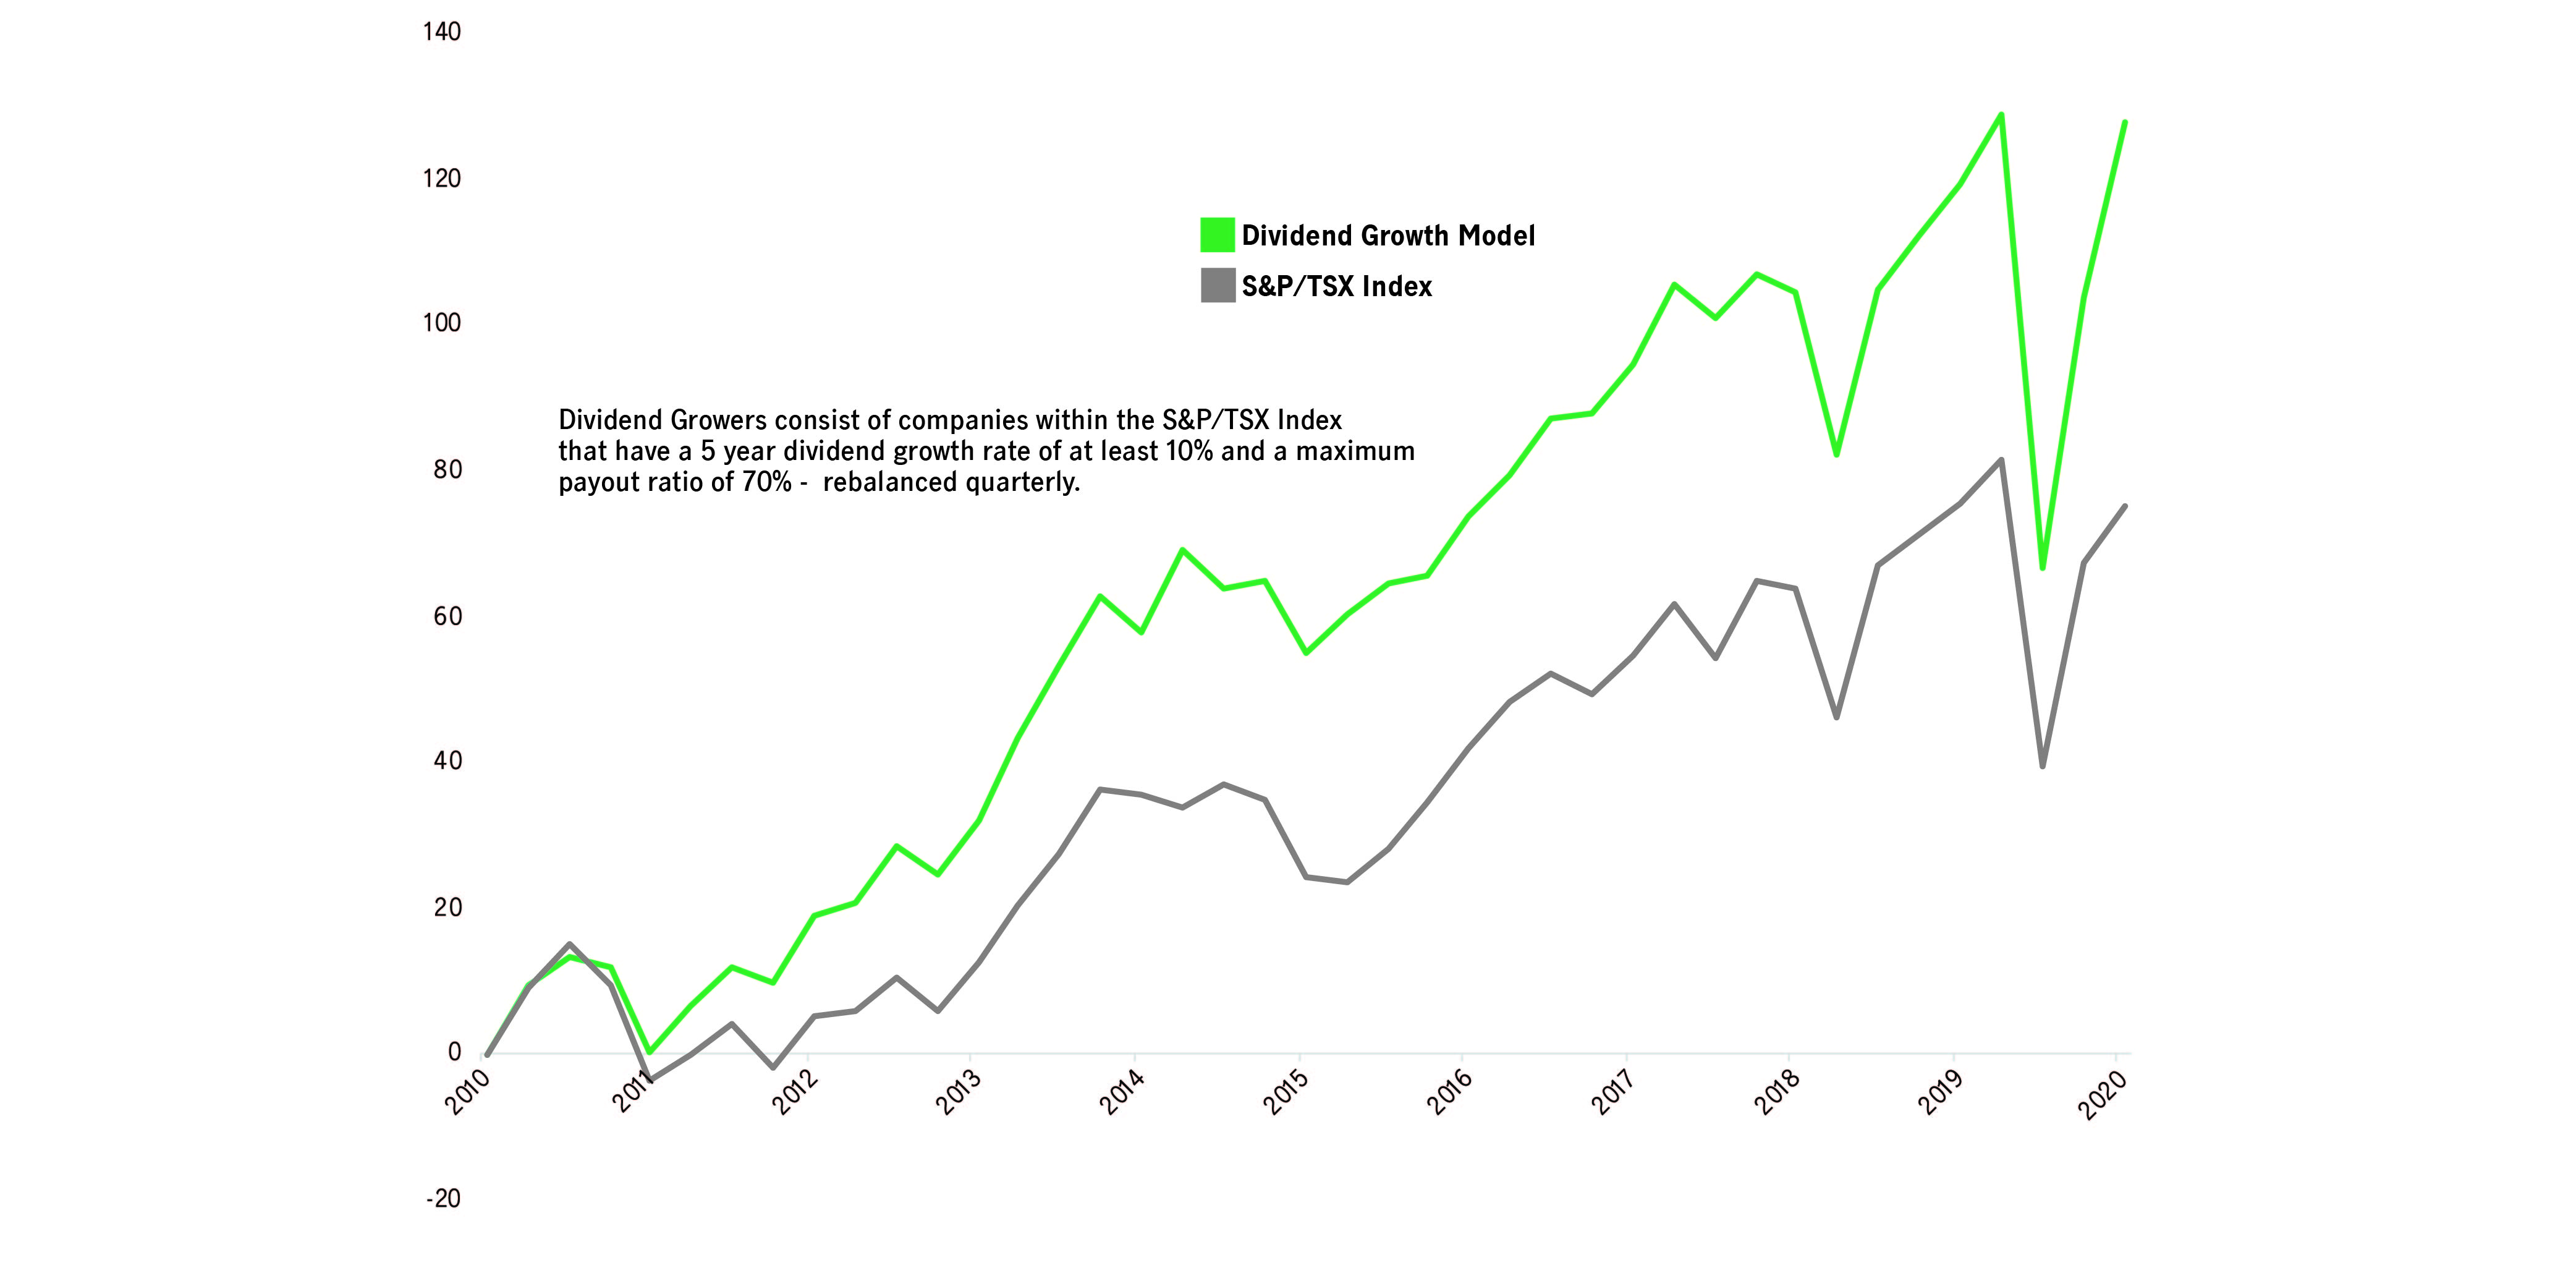
Using Bloomberg, we screened the S&P/TSX Index for companies with a five-year dividend growth rate of at least 10% and a payout ratio of no more than 70%. This screen was backtested and rebalanced on a quarterly basis, going back 10 years, to September 30, 2020. The model has a 10-year annualized performance of 7.65%, while the S&P/TSX Composite Index returned 4.92% over the same period. These results assume all dividends are paid out and not reinvested.
Capital Markets Strategy Dividend Growth Model vs. S&P /TSX Composite Index
Cumulative Return (2010 – 2020)
While it would seem obvious to just buy and hold the screened model, some discretion is required due to liquidity, diversification, and valuation. The model currently only has 24 companies following our screen, with a median market cap of approximately CAD 4 billion. Dividend growth combined with appropriate payout ratios are a good way to identify quality businesses, however, we must also pay attention to valuation. The search for yield has driven valuation for certain companies to levels that no longer offer attractive entry points. Paying attention to the price you pay as well as exit points remains equally important as buying quality businesses.
Today, we’re faced with a demographic in North America, Japan, and Europe that’s aging and with large proportions in or near retirement. The need for income is paramount. Unfortunately, we’re also in an environment in which government bonds offer low yields, perhaps far lower than what would sustain a suitable retirement income. Further, if rates rise (which they’re likely to do over time), that puts pressure on bond prices, much like what was experienced in the 1950s through the following 30 years. Ross Goobey recognized these issues in his time and found his solution in dividend-paying equities. With many companies more willing to return capital to shareholders in the form of increased dividends (or in some cases, share buybacks), today's investors may also find a solution in dividends, and to be more specific, dividend-growing equities.
Kevin Headland
Senior Investment Strategist
1 https://www.pensionsarchive.org.uk/27/text/27/files/Autum_Conference.pdf
A rise in interest rates typically causes bond prices to fall. The longer the average maturity of the bonds held by a fund, the more sensitive a fund is likely to be to interest-rate changes. The yield earned by a fund will vary with changes in interest rates.
Currency risk is the risk that fluctuations in exchange rates may adversely affect the value of a fund’s investments.
The opinions expressed are those of Manulife Investment Management as of the date of this publication, and are subject to change based on market and other conditions. The information and/or analysis contained in this material have been compiled or arrived at from sources believed to be reliable but Manulife Investment Management does not make any representation as to their accuracy, correctness, usefulness or completeness and does not accept liability for any loss arising from the use hereof or the information and/or analysis contained herein. Manulife Investment Management disclaims any responsibility to update such information. Neither Manulife Investment Management or its affiliates, nor any of their directors, officers or employees shall assume any liability or responsibility for any direct or indirect loss or damage or any other consequence of any person acting or not acting in reliance on the information contained herein.
All overviews and commentary are intended to be general in nature and for current interest. While helpful, these overviews are no substitute for professional tax, investment or legal advice. Clients should seek professional advice for their particular situation. Neither Manulife, Manulife Investment Management Limited, Manulife Investment Management, nor any of their affiliates or representatives is providing tax, investment or legal advice. Past performance does not guarantee future results. This material was prepared solely for informational purposes, does not constitute an offer or an invitation by or on behalf of Manulife Investment Management to any person to buy or sell any security and is no indication of trading intent in any fund or account managed by Manulife Investment Management. No investment strategy or risk management technique can guarantee returns or eliminate risk in any market environment. Unless otherwise specified, all data is sourced from Manulife Investment Management.
Manulife, Manulife Investment Management, the Stylized M Design, and Manulife Investment Management & Stylized M Design are trademarks of The Manufacturers Life Insurance Company and are used by it, and by its affiliates under license.